Supply and Demand Zones in Forex: How to Mark, Trade and Manage Risk
You can also read our content about High Profitable Trade SetUp.
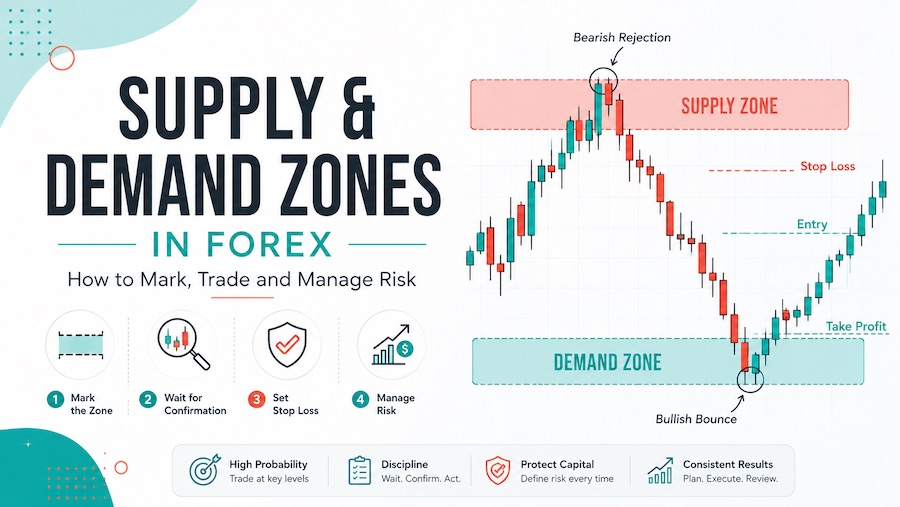
Supply and demand zones are price areas where the market previously moved away with force. A demand zone shows an area where buying pressure was strong enough to push price higher. A supply zone shows an area where selling pressure was strong enough to push price lower. This guide explains how to mark those zones, how to judge their quality, and how to plan example trades on forex pairs, gold (XAU/USD), and silver (XAG/USD).
Keywords covered naturally: supply and demand zones, forex supply demand strategy, gold supply demand zones, XAU/USD demand zone, XAG/USD supply zone, institutional zones, rally base drop, drop base rally, support and resistance, candlestick chart examples.
What Supply and Demand Zones Mean
A supply or demand zone is not a random rectangle. It is a price area where the chart shows imbalance. In simple words, imbalance means one side of the market became much stronger than the other side. If price pauses for a few candles and then leaves the area with large candles, that pause area becomes important.
A demand zone forms before a strong bullish move. It often appears as a small base after a fall, followed by a strong rally. A supply zone forms before a strong bearish move. It often appears as a small base after a rise, followed by a strong drop. The base is the zone. The strong move away is the evidence.
Simple zone formula:
Demand Zone = Base Before Strong Rally
Supply Zone = Base Before Strong Drop
High-Quality Zone = Clean Base + Strong Departure + Fresh Retest + Good Risk-to-Reward
Supply and demand zones are closely related to support and resistance, but they are not exactly the same. Support and resistance usually focus on repeated reactions at a level. Supply and demand focus more on where the strongest imbalance started. A support line may show where price reacted many times. A demand zone shows where buyers previously took control with force.
Four common supply and demand patterns
| Pattern | Zone Type | What It Means | Example Use |
|---|---|---|---|
| Drop-Base-Rally | Demand | Price falls, pauses in a base, then rallies strongly. | Look for a possible buy if price later returns and confirms rejection. |
| Rally-Base-Drop | Supply | Price rises, pauses in a base, then drops strongly. | Look for a possible sell if price later returns and confirms rejection. |
| Rally-Base-Rally | Demand continuation | Price rallies, rests briefly, then continues higher. | Useful in strong uptrends when a pullback returns to the base. |
| Drop-Base-Drop | Supply continuation | Price drops, rests briefly, then continues lower. | Useful in strong downtrends when a pullback returns to the base. |
How to Draw Supply and Demand Zones Correctly
The most common mistake is drawing the zone around the entire move. Do not draw the zone around the big rally or the big drop. Draw the zone around the small base before the move. That base is where the imbalance likely began.
How to draw a demand zone
- Find a strong bullish move that left an area quickly.
- Look left and identify the final small base before that rally.
- Mark the upper edge near the highest candle body inside the base.
- Mark the lower edge at the lowest wick of the base or the last bearish candle before the rally.
- Only plan a buy if price returns to the zone and shows rejection or confirmation.
How to draw a supply zone
- Find a strong bearish move that left an area quickly.
- Look left and identify the final small base before that drop.
- Mark the lower edge near the lowest candle body inside the base.
- Mark the upper edge at the highest wick of the base or the last bullish candle before the drop.
- Only plan a sell if price returns to the zone and shows rejection or confirmation.
Zone boundary formula:
Conservative Zone = Candle Body Cluster of the Base
Full Zone = Extreme Wick of the Base to Opposite Body Edge
Invalid Zone = Price Closes Beyond the Opposite Edge with Strength
Demand Zone Examples
A demand zone is a buying area. It does not mean you should buy blindly. The better approach is to mark the zone, wait for price to return, then look for a bullish reaction, such as a rejection wick, engulfing candle, or break of a small lower-timeframe structure.
Example demand-zone checklist
- Good sign: The rally away from the base is larger than the candles inside the base.
- Good sign: Price spent little time in the base, usually one to six candles.
- Good sign: The rally breaks a previous minor high or creates fresh momentum.
- Weak sign: The base is too wide, messy, and full of overlapping candles.
- Weak sign: Price has already retested the same demand zone many times.
Supply Zone Examples
A supply zone is a selling area. It is created when price builds a small base and then drops strongly. The best supply zones are usually fresh, tight, and followed by an aggressive move away. When price returns to the zone, you look for rejection rather than selling blindly.
How to Score Zone Quality
Not every zone is worth trading. A strong trading plan filters zones before thinking about entry. A fresh zone with a clean departure is usually better than a zone that has already been tested several times.
| Factor | Strong Zone | Weak Zone |
|---|---|---|
| Departure | Large candles leave the base quickly and break structure. | Small candles drift away slowly with no clear momentum. |
| Time at base | One to six candles, clean and easy to see. | Many overlapping candles, messy compression, unclear edge. |
| Freshness | Price has not returned to the zone yet. | Price has already touched the zone multiple times. |
| Location | Zone sits near higher-timeframe structure, previous high/low, or session extreme. | Zone is in the middle of a choppy range with nearby opposing levels. |
| Risk-to-reward | There is clear room to the next opposing zone. | The next support or resistance is too close. |
Zone quality scoring model
Zone Score = Departure Strength + Clean Base + Freshness + Higher-Timeframe Location + Room to Target
A+ Zone = 4 or 5 Factors Present
B Zone = 3 Factors Present
No Trade = 2 or Fewer Factors Present
Best Timeframes for Forex, Gold and Silver
Supply and demand zones are more useful when you separate level selection from entry timing. Use a higher timeframe to mark the zone, then use a lower timeframe to find the entry.
| Trading Style | Mark Zones On | Confirm Entry On | Best Use |
|---|---|---|---|
| Scalping | 1H and 15M | 5M or 3M | Fast entries, but higher risk of noise and false reactions. |
| Intraday | 4H and 1H | 15M or 5M | Practical for XAU/USD, XAG/USD, EUR/USD, GBP/USD, and USD/JPY. |
| Short-term swing | Daily and 4H | 1H or 30M | Cleaner zones with fewer trades and less screen time. |
| Swing trading | Weekly and Daily | 4H | Best for patient traders who want broader moves. |
Gold and silver notes
- XAU/USD: Use 4H and 1H zones for intraday planning. Gold can sweep a zone before reacting, so avoid placing stops too close.
- XAG/USD: Silver can move sharply around whole and half-dollar areas, but a round number must still line up with a real supply or demand zone.
- Major forex pairs: EUR/USD and GBP/USD often give cleaner London and New York session reactions. USD/JPY can react strongly around psychological levels and news.
Entry, Stop Loss, Targets and Risk Formula
Supply and demand trading becomes dangerous when traders enter without a defined stop. The zone only tells you where price may react. It does not remove risk. Plan the entry, stop loss, target, and position size before entering.
Three possible entry styles
- Limit entry: Place an order inside the zone before confirmation. This can give better price but has higher risk because price may cut through the zone.
- Confirmation entry: Wait for a rejection wick, engulfing candle, or structure break after price touches the zone. This is slower but usually cleaner.
- Retest entry: Wait for price to leave the zone, then enter on a small retest. This can reduce emotional chasing.
Risk formulas:
Risk Amount = Account Equity x Risk Percentage
Position Size = Risk Amount / (Stop Distance x Value Per Point or Pip)
Buy R:R = (Target Price – Entry Price) / (Entry Price – Stop Price)
Sell R:R = (Entry Price – Target Price) / (Stop Price – Entry Price)
A practical rule is to avoid trades below 1:2 reward-to-risk. If your stop is 50 points, the first logical target should ideally be at least 100 points away. If the next opposing zone is too close, the trade is usually not worth taking.
Stop-loss placement examples
- Demand-zone buy: Stop goes below the lowest wick of the demand zone plus a small volatility buffer.
- Supply-zone sell: Stop goes above the highest wick of the supply zone plus a small volatility buffer.
- Gold setup: Use a wider buffer than most forex pairs because XAU/USD can spike around highs and lows.
- Silver setup: Reduce position size if the stop distance expands around volatile sessions.
Stop Buffer = Max(0.10 to 0.25 x ATR(14), Spread + Expected Slippage)
Checklist Before Trading a Supply or Demand Zone
- Is the zone visible on a higher timeframe, not only a tiny chart?
- Did price leave the zone with strong momentum?
- Is the base clean and not too wide?
- Is the zone fresh or only lightly tested?
- Is price returning to the zone for a clear reason, such as a pullback, sweep, or retest?
- Is there confirmation before entry, such as a rejection wick, engulfing candle, or structure break?
- Is the stop outside the zone, not inside the zone?
- Is the next opposing zone far enough away for at least 1:2 reward-to-risk?
- Are you avoiding major news or reducing risk around high-impact events?
- Are you risking a fixed percentage instead of increasing size after a loss?
Common Mistakes with Supply and Demand Zones
- Drawing zones too large: A huge rectangle creates a wide stop and unclear entry. Focus on the base before the move.
- Buying every demand zone: A demand zone can fail if the higher-timeframe trend is strongly bearish or news changes volatility.
- Selling every supply zone: A supply zone can break if buyers are strong enough to absorb the selling pressure.
- Ignoring freshness: The fifth retest of a zone is usually weaker than the first clean retest.
- Entering inside the middle of nowhere: The best zones sit near meaningful structure, not random candles in the center of a range.
- Forcing trades on small timeframes: A 1-minute zone can look perfect but fail because the higher timeframe is moving against it.
Frequently Asked Questions
Are supply and demand zones the same as support and resistance?
They are related, but not identical. Support and resistance usually mark repeated reactions. Supply and demand zones mark areas where a strong imbalance began. A demand zone can act like support, and a supply zone can act like resistance, but the reason for drawing them is different.
What is the best supply and demand zone pattern?
The cleanest patterns are Drop-Base-Rally for demand and Rally-Base-Drop for supply. Rally-Base-Rally and Drop-Base-Drop can also matter, but the strongest examples usually have a clear base and a sharp departure.
Should I enter as soon as price touches the zone?
Newer traders should usually wait for confirmation. A touch alone is not proof that the zone will hold. Confirmation can be a rejection wick, engulfing candle, market structure shift, or strong close back in the expected direction.
Do supply and demand zones work on gold and silver?
They can be useful on gold and silver, but volatility is important. XAU/USD and XAG/USD can spike through zones before reacting. Use higher-timeframe zones, reasonable stop buffers, and smaller position size when volatility expands.
Can supply and demand trading guarantee profit?
No. No zone, pattern, indicator, or strategy guarantees profit. Supply and demand zones are planning tools. The real edge comes from selectivity, confirmation, position sizing, and accepting that some zones will fail.
Final Thoughts
Supply and demand zones help you read where price previously reacted with strength. The best zones are clean, fresh, and created by a strong move away from a small base. In forex, gold, and silver, the goal is not to predict every candle. The goal is to wait for price to return to a meaningful area, confirm reaction, and then trade only when the risk-to-reward makes sense.
If you mark zones from the base, check the quality of the departure, wait for confirmation, and protect the account with fixed risk, supply and demand analysis becomes much more practical. The trader who waits for clean zones usually has a better process than the trader who clicks every time price touches a rectangle.