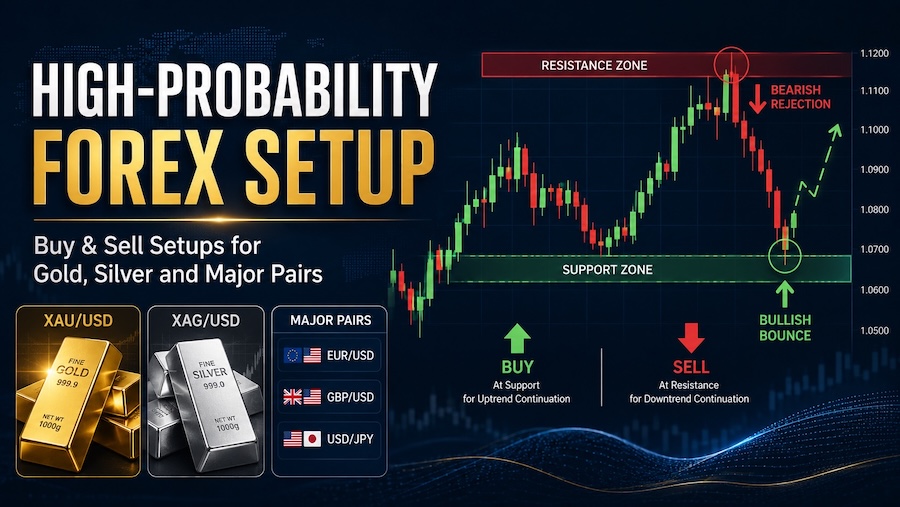
High-Probability Forex Setup for Buying and Selling Gold, Silver and Major Currency Pairs
A high-probability forex setup is not a magic candle pattern. It is a repeatable decision process where trend, support and resistance, liquidity, candlestick confirmation, risk-to-reward, and timing all point in the same direction. This guide explains a clean setup you can use for major forex pairs, gold (XAU/USD), silver (XAG/USD), and other liquid instruments without guessing every small move.
Keywords covered naturally: high probability forex setup, gold trading setup, silver trading setup, XAU/USD strategy, XAG/USD strategy, support and resistance forex, candlestick confirmation, liquidity sweep, buy and sell forex setup, risk to reward trading.
The Setup Idea in Simple Words
The best forex trades usually start before the entry candle appears. First, price reaches an important area. Then it traps early buyers or sellers. Then it prints a candle that shows rejection. Only after that do you plan the entry, stop loss, and target.
The setup in this article is built around one core idea: wait for price to reach a higher-timeframe support or resistance zone, sweep liquidity beyond that zone, close back inside the range, and then enter only if the next candle confirms direction. This works better than buying because price “looks cheap” or selling because price “looks high.”
High-probability setup formula:
Bias + Key Level + Liquidity Sweep + Confirmation Candle + Minimum 1:2 Risk-to-Reward = Trade Setup
If even one part is missing, the setup is weaker. For example, a bullish engulfing candle in the middle of nowhere is not enough. A support zone is not enough. A sweep is not enough. The edge comes from the combination.
Best Chart Duration and Timeframe Combination
The timeframe should match your trading style. A common mistake is using a 1-minute or 5-minute chart to make every decision. Small timeframes are noisy, especially on gold and silver. The cleanest approach is multi-timeframe analysis: use a higher timeframe for direction and levels, then use a lower timeframe only for the entry.
| Trading Style | Market Bias | Mark Levels On | Entry Timeframe | Best For |
|---|---|---|---|---|
| Scalping | 1H | 30M or 15M | 5M or 3M | Experienced traders only; fast gold and major-pair sessions |
| Intraday | 4H | 1H | 15M or 5M | Gold, silver, EUR/USD, GBP/USD, USD/JPY |
| Short-term swing | Daily | 4H | 1H or 30M | Cleaner setups with fewer trades |
| Swing trading | Weekly | Daily | 4H | Traders who do not want to watch the chart all day |
For most traders, the 4H + 1H + 15M combination is the most practical. Use the 4H chart to decide whether the market is trending or ranging. Use the 1H chart to mark support, resistance, previous highs and previous lows. Use the 15M chart to wait for the sweep and confirmation candle.
On gold and silver, avoid forcing trades during dead market hours. These instruments often move best around the London session, New York session, and high-impact news windows. That does not mean you should trade every news event. It means you should know when volatility may expand so you are not surprised by a sudden candle spike.
Where Support and Resistance Really Exist
Support and resistance should be marked as zones, not thin lines. A single line makes the chart look precise, but live price rarely respects one exact number. A zone is more realistic because spreads, liquidity, different brokers, and fast order flow can push price slightly above or below a level before the real move starts.
Mark support where these conditions appear
- Price previously rejected the area with strong bullish candles.
- A down move slowed down, formed wicks, and then price pushed upward with momentum.
- The area sits near a previous day low, previous week low, session low, or major swing low.
- Price broke above the area earlier and is now returning to retest it from above.
- The zone is visible on the 1H, 4H, daily, or weekly chart, not only on a tiny entry chart.
Mark resistance where these conditions appear
- Price previously rejected the area with strong bearish candles.
- An up move slowed down, formed upper wicks, and then price dropped with momentum.
- The area sits near a previous day high, previous week high, session high, or major swing high.
- Price broke below the area earlier and is now returning to retest it from below.
- The zone is obvious on higher timeframes and not created only to justify a trade.
Support zone formula:
Support Zone = Swing-Low Wick Area to Rejection Candle Body Cluster
Resistance zone formula:
Resistance Zone = Swing-High Wick Area to Rejection Candle Body Cluster
Practical support and resistance examples
| Chart Area | How to Mark It | Why It Matters |
|---|---|---|
| Previous day low on XAU/USD | Draw support from the lowest wick to the body cluster that rejected upward. | It is a common liquidity area where sellers may get trapped if price sweeps and reclaims it. |
| Previous day high on XAU/USD | Draw resistance from the highest wick to the body cluster that rejected downward. | Breakout buyers often enter there; a failed break can create a strong sell setup. |
| Broken resistance on EUR/USD | After a clean breakout, keep the old resistance zone and watch the retest from above. | Old resistance can become new support when buyers defend the retest. |
| Broken support on GBP/USD | After a clean breakdown, keep the old support zone and watch the retest from below. | Old support can become new resistance when sellers defend the retest. |
| Round number on silver | Use the round number only if it also lines up with wicks, bodies, or prior structure. | A round number alone is not enough; structure must confirm that traders are reacting there. |
For gold, round numbers can matter because many traders watch them. For example, levels ending in 00, 50, or major psychological numbers often attract attention. For silver, whole and half-dollar zones can become active. For forex pairs, whole numbers and half numbers such as 1.1000, 1.1050, or 150.00 can matter. Still, a round number alone is not a trade. It becomes useful only when it lines up with structure, rejection, and risk-to-reward.
High-Probability Buy Setup
A high-probability buy setup appears when price reaches support, runs below the obvious low to trigger stops, fails to continue lower, and then closes back above the support area. That wick below support is important. It shows that sellers had a chance to continue the move, but buyers absorbed the pressure.
Buy setup rules
- Higher-timeframe bias: 4H or daily structure should be bullish, or price should be trading into a major support zone where a bounce is realistic.
- Support zone: Mark the zone from the wick low to the body cluster of the last strong rejection or breakout origin.
- Liquidity sweep: Price should take out an obvious low, previous session low, or support-zone low, then fail to continue downward.
- Confirmation candle: A bullish candle should close back above support. Stronger confirmation appears when the candle body is large, the lower wick is clear, and the close is near the candle high.
- Entry: Enter on a retest of the confirmation candle midpoint, a retest of the reclaimed support, or a break above the confirmation candle high. Do not chase if the candle is already too far from the stop.
- Stop loss: Place the stop below the sweep low, not inside the support zone. Add a small buffer based on spread and volatility.
- Target: First target is the nearest clean resistance or prior swing high. The trade should offer at least 1:2 risk-to-reward before entry.
This buy setup is especially useful on XAU/USD when price sweeps a previous day low or London session low, then quickly returns above the level. It can also work on silver and major currency pairs, but the principle is the same: do not buy because price fell. Buy only when price falls into a meaningful level, traps sellers, and then proves rejection.
High-Probability Sell Setup
The sell setup is the opposite. Price rises into resistance, pushes above the obvious high to trigger breakout buyers and stop losses from short sellers, then fails to hold above resistance. Once price closes back below the resistance zone, the market has shown a possible bull trap.
Sell setup rules
- Higher-timeframe bias: 4H or daily structure should be bearish, or price should be trading into a major resistance zone where rejection is realistic.
- Resistance zone: Mark the zone from the wick high to the body cluster of the last strong rejection or breakdown origin.
- Liquidity sweep: Price should take out an obvious high, previous session high, or resistance-zone high, then fail to continue upward.
- Confirmation candle: A bearish candle should close back below resistance. Stronger confirmation appears when the candle body is large, the upper wick is clear, and the close is near the candle low.
- Entry: Enter on a retest of the confirmation candle midpoint, a retest of rejected resistance, or a break below the confirmation candle low.
- Stop loss: Place the stop above the sweep high, not inside the resistance zone. Add a small buffer based on spread and volatility.
- Target: First target is the nearest clean support or prior swing low. Avoid entering if there is not enough room for at least 1:2 risk-to-reward.
What to Mark on the Chart Before Trading
A clean chart is better than a chart full of indicators. Before entering a trade on gold, silver, or any forex pair, mark only the areas that actually affect your decision.
- Higher-timeframe trend: Mark whether price is making higher highs and higher lows, lower highs and lower lows, or moving sideways.
- Major swing highs and lows: These are the obvious turning points every trader can see. They often act as liquidity pools.
- Support and resistance zones: Use candle bodies and wick extremes. Do not draw one thin line and pretend it is exact.
- Previous day high and low: These are especially useful for intraday gold and silver setups.
- Session high and low: London and New York session highs and lows can act as short-term liquidity areas.
- News windows: Mark high-impact events if you trade intraday. News can invalidate a clean technical setup by expanding spread and volatility.
- Entry, stop and target before entry: If you cannot place these three levels before clicking buy or sell, the trade is not ready.
Risk Formula, Stop Loss and Position Size
The setup is only useful if the risk is controlled. A good entry with a bad position size can still damage the account. The trade should be planned from the stop loss first, not from the profit target.
Risk amount formula:
Risk Amount = Account Equity x Risk Percentage
Position size formula:
Position Size = Risk Amount / (Stop Distance x Value Per Point or Pip)
Reward-to-risk formula for a buy:
R:R = (Target Price – Entry Price) / (Entry Price – Stop Price)
Reward-to-risk formula for a sell:
R:R = (Entry Price – Target Price) / (Stop Price – Entry Price)
A simple rule is to risk 0.5% to 1% per trade, especially on gold and silver because they can move sharply. New traders often risk too much because the setup “looks obvious.” That is exactly when discipline matters most. No single setup should decide the future of the account.
Stop-loss buffer formula
The stop should not sit exactly on the sweep high or sweep low. Price often retests that area. Use a small buffer:
Stop Buffer = Max(0.10 to 0.25 x ATR(14) on Entry Timeframe, Spread + Expected Slippage)
ATR means Average True Range. You do not need to overcomplicate it. If the market is moving fast, the stop needs more room or the position size needs to be smaller. If the required stop is too large and the target is too close, skip the trade.
Example position-size calculation
Suppose your account equity is $5,000 and you want to risk 1%. Your risk amount is $50. If your gold setup has a stop distance of 5.00 points and your broker’s contract value is $100 per 1.00 move for one standard lot, the calculation is:
$50 / (5.00 x $100) = 0.10 standard lot
Contract value can differ by broker, account type, and instrument. Always check your platform’s specification before using any position-size calculation.
The Best Market Conditions for This Setup
The setup works best when the market has clear structure. You want price to move from one meaningful level to another. If the chart is messy, compressed, and full of overlapping candles, the edge is weaker.
| Condition | Good for Setup? | Reason |
|---|---|---|
| Clear higher-timeframe trend | Yes | Pullbacks into support or resistance are easier to judge. |
| Clean range with obvious high and low | Yes | Sweeps of the range high or range low can create strong reversals. |
| Overlapping candles with no direction | No | Support and resistance become less reliable when price is compressed. |
| Immediately before major news | Usually no | Spreads and volatility can expand, making technical levels less reliable. |
| Price already far from the level | No | The stop becomes too wide or the entry becomes a chase. |
How to Use This Setup on Gold and Silver
Gold and silver often respect structure, but they can move faster than many currency pairs. Gold can run stops around previous highs and lows before reversing. Silver can also spike, especially when the dollar moves sharply or metals volatility expands. Because of that, the setup should be traded with patience and wider planning.
For gold (XAU/USD)
- Use the 4H chart to define trend and major levels.
- Use the 1H chart to mark previous day high, previous day low, and strong rejection zones.
- Use the 15M chart for confirmation. The 5M chart can help with tighter entries, but only after the 15M area is clear.
- Expect stop runs around session highs and lows. Do not enter before the sweep if your setup requires a sweep.
- Use ATR or recent candle size for stop buffers because fixed tiny stops are often too tight for gold.
For silver (XAG/USD)
- Mark whole and half-dollar areas only if they line up with real structure.
- Watch for sharp wicks at previous highs and lows.
- Use the same buy and sell rules, but reduce position size if the stop distance expands.
- Do not assume silver will move exactly like gold. They can correlate at times, but each chart must confirm independently.
For major forex pairs
- EUR/USD and GBP/USD often give cleaner intraday structure during London and New York.
- USD/JPY can respect psychological levels, but volatility can expand quickly when yields or dollar sentiment shift.
- AUD/USD and USD/CAD may react strongly to commodity and central-bank expectations, so technical setups should not ignore scheduled news.
Checklist Before Entering Any Trade
Use this checklist before every buy or sell. If the trade fails the checklist, wait. There will always be another setup.
- Is the higher-timeframe direction clear?
- Is price at a support or resistance zone marked from a higher timeframe?
- Did price sweep liquidity beyond the zone?
- Did the confirmation candle close back inside the structure?
- Is the stop loss outside the sweep high or sweep low?
- Is the target at a logical opposing level?
- Is the minimum reward-to-risk at least 1:2?
- Is the risk 0.5% to 1% of account equity or less?
- Is there enough room before the next support or resistance?
- Are you avoiding major news or adjusting risk because of it?
Simple scoring model:
A+ Setup = 8 to 10 Checklist Points Passed
B Setup = 6 to 7 Checklist Points Passed
No Trade = 5 or Fewer Checklist Points Passed
This scoring model keeps you from taking emotional trades. A setup does not need to be perfect, but it must be complete. The real purpose of the checklist is to stop random entries.
Common Mistakes That Ruin This Setup
- Drawing too many levels: If every price is support or resistance, no level matters. Mark only the levels that price clearly respected or broke with force.
- Entering before confirmation: A sweep is not enough. Wait for a candle close back above support for a buy or below resistance for a sell.
- Using stops that are too tight: If the stop is inside the wick area, normal retesting can knock you out before the move starts.
- Trading into the next level: Do not buy directly below resistance or sell directly above support unless there is enough reward-to-risk.
- Ignoring market sessions: Gold and silver can be quiet, then suddenly expand. Know when London, New York, and major news can affect volatility.
- Risking more after a loss: The setup needs a stable risk model. Increasing risk to recover losses usually destroys discipline.
Example Trade Plan Template
Before placing a trade, write the plan in one clear paragraph. If the plan sounds confusing, the trade is probably not clean.
Instrument: XAU/USD or XAG/USD or Forex Pair
Bias: Bullish / Bearish / Range
Higher-Timeframe Level: 4H Support or 4H Resistance
Trigger: Sweep + Candle Close Back Above or Below Level
Entry: Retest or Break of Confirmation Candle
Stop: Beyond Sweep High or Low + Buffer
Target: Opposing Level or 2R to 3R
Risk: 0.5% to 1% Maximum
Frequently Asked Questions
What is the best timeframe for this high-probability forex setup?
For most traders, use 4H for direction, 1H for support and resistance, and 15M for entry confirmation. Scalpers can use 1H, 15M, and 5M, but small timeframes require faster decisions and tighter discipline.
Can this setup be used for gold and silver?
Yes, the structure can be used on gold and silver because both markets often react around major highs, lows, and liquidity areas. The key difference is volatility. Gold and silver can require wider stops and smaller position size than slower forex pairs.
Is a liquidity sweep the same as a fake breakout?
They are similar. A liquidity sweep means price moves beyond an obvious high or low, triggers orders, then fails to continue. A fake breakout is the visible result. For this setup, the important part is the candle close back above support for a buy or back below resistance for a sell.
How much should I risk per trade?
Many disciplined traders keep risk around 0.5% to 1% per trade. The right amount depends on your experience, account size, market volatility, and emotional control. The setup is not high probability if the risk is too large for the account.
Does this strategy guarantee profit?
No. No forex, gold, or silver strategy guarantees profit. The purpose of a high-probability setup is to avoid random trades and create a consistent decision process. Losses are part of trading, so risk control matters more than being right on one trade.
Final Thoughts
A strong buy or sell setup is not about predicting the market with confidence. It is about waiting for price to reach a level where the risk is clear, watching how price behaves around that level, and entering only after rejection is confirmed. For gold, silver, and major forex pairs, the same logic applies: higher-timeframe level first, liquidity sweep second, confirmation third, risk management always.
If you mark real support and resistance, wait for the sweep, use candle confirmation, and accept only trades with clean risk-to-reward, your trading becomes more selective. Selective trading is the heart of any high-probability forex setup.